How to Fit One Spectrum
The low-level functions in the DAP treat each spectrum independently. As such, it’s possible to use these functions to effectively fit any spectrum you like. Here, we guide you through the example script in examples/fit_one_spec.py. Note this isn’t an abstracted executable included in the package distribution, but is meant to be something you use as a starting point for your own script. There is additional guidance in the comments of the script itself that is not replicated here.
Workflow Overview
The script performs the following steps:
Load the spectrum to fit.
Define the keywords used by the DAP to establish how the data will be analyzed.
Fit the stellar continuum using
PPXFFit, primarily to measure the stellar kinematics. Show the result if requested.Measure non-parametric moments of the spectrum in windows at the expected locations of a set of emission lines. This analysis is done on the observed spectra after subtracting the best-fitting continuum determined in step 3.
Simultaneously fit the stellar continuum (with the kinematics fixed from step 3) and single-Gaussian profiles for the emission lines. Show the result, if requested.
Re-measure the non-parametric emission-line moments with the updated redshift and best-fitting stellar continuum, and show a plot comparing the Gaussian fitted and non-parametric fluxes.
If any were defined, measure a set of spectral indices. This includes a computation and application of velocity dispersion corrections. Print the resulting measurements for a few indices.
Execution details and user flexibility
The low-level functions used in the script are very general; however, there are still a few expectations for the input.
The spectra to be fit must be geometrically binned in wavelength (e.g., spectral channels have a constant with in
log(lambda)). If you’re input spectrum has linear wavelength steps, you can use theResampleclass to resample your data. This comes with all the relevant caveats about how this resampling will affect the spectral noise properties. See Resampling.All error analysis in the DAP currently assumes the provided spectral flux error vectors are accurate, and there is currently no treatment of spectral covariance. If the error estimates for your spectra are systematically in error, so too will be the errors returned for the provided measurements.
You must have an estimate of the redshift that is within \(\pm 2000\) km/s of the true value. This is driven by the bounds imposed by ppxf, which cannot yet be altered without digging deep into the DAP code. The inputs also accept a guess for the velocity dispersion, but this has very little, if any, affect on the best-fitting result.
The quality of the velocity dispersion measurements critically depend on the estimates of the spectral resolution in your data. However, this is mostly a statement about the accuracy of the velocity dispersion corrections. If you’re unsure of the spectral resolution of your data, do not trust the velocity dispersion corrections provided.
Masking is performed in two ways: (1) The spectra can have pixel-by-pixel masks the exclude these data from any analysis step. These masks are for regions, e.g., affected by poor sky subtraction. (2) Specific regions can be masked during the full-spectral-fitting modules (
PPXFFitandSasuke). In the example script, these are defined using theSpectralPixelMaskclass. The class accepts database files that indicate regions affected by artifacts, emission lines that should be ignored during the stellar continuum fit, or the ability to restrict the fit to a fixed rest wavelength. In the example script, the 5577 sky line is masked as having been poorly subtracted and all emission lines in theELPMPL11database are masked.The templates used during the spectral fitting functions,
PPXFFitfor the stellar kinematics andSasukefor the emission-line modeling, are set via keywords. Descriptions of the available options and how to use custom template libraries are described here: Spectral Template Libraries.The databases used for the non-parametric emission-line moments and the emission-line Gaussian modeling are set via separate keywords. Descriptions of the available options and how to use custom emission-line sets are described here: Emission-Line Measurements.
The databases used to define the spectral indices used are defined separately for absorption-line indices — i.e., indices measuring the EW of an absorption feature relative to the continuum — and “bandhead” or “color” indices — i.e., indices measured by comparing the continuum level in two adjacent sidebands. Descriptions of the available options and how to use custom index sets are described here: Spectral Indices.
Analysis Results
Currently the script does not save any of the results of the fit. You’re
encouraged to use IPython.embed to spawn an ipython session at the end of the
script (but within the main function) to interact with the objects
containing the results. If you place an embed() statement just before the
last print statement in the main function, you can do the following (after
executing python fit_one_spec.py on the command line):
In [1]: cont_par.dtype.names
Out[1]:
('BINID',
'BINID_INDEX',
'MASK',
'BEGPIX',
'ENDPIX',
'NPIXTOT',
'NPIXFIT',
'TPLWGT',
'TPLWGTERR',
'USETPL',
'ADDCOEF',
'MULTCOEF',
'KININP',
'KIN',
'KINERR',
'CHI2',
'RCHI2',
'CHIGRW',
'RMS',
'RMSGRW',
'FRMS',
'FRMSGRW',
'SIGMACORR_SRES',
'SIGMACORR_EMP')

In [2]: cont_par["KIN"]
Out[2]: array([[ 8754.982579  ,    68.85966735]])

In [3]: cont_par["TPLWGT"]
Out[3]:
array([[ 0.00140314,  0.        ,  0.        ,  0.        ,  0.        ,
        0.        ,  0.        ,  0.        ,  0.        ,  0.        ,
        0.        ,  0.        ,  0.00579377,  0.00402099,  0.01253188,
        0.        ,  0.00626336,  0.        ,  0.01588571,  0.        ,
        0.10398248,  0.        ,  0.        ,  0.        ,  0.00147509,
        0.        ,  0.04152064,  0.00120283,  0.        ,  0.00409837,
        0.00670623,  0.        ,  0.03013952,  0.        ,  0.        ,
        0.        ,  0.        ,  0.00532783,  0.12609806,  0.01856902,
        0.00477959,  0.        ]])
Examining the Results
The script creates three plots and provides a table with a few of the measured Lick indices:
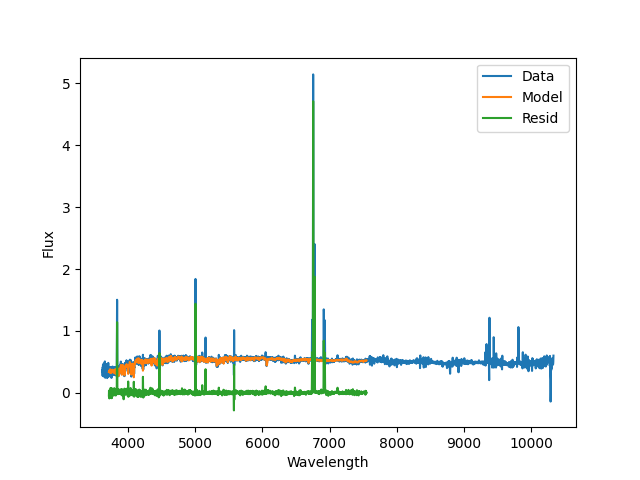
A plot of the stellar continuum fit produced by
PPXFFit; blue is the data, orange is the best
fit model, and green are the residuals. Note that the emission lines are
masked during this fit, and the model spectral range is limited by the MILES
templates used during the fit.
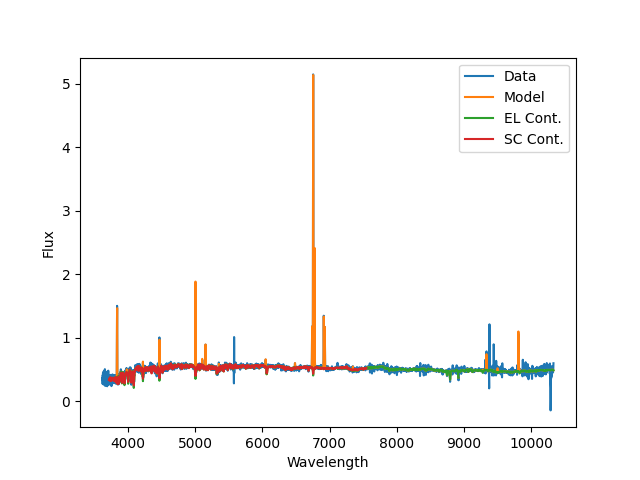
A plot of the emission-line modeling fit produced by
Sasuke; blue is the data, orange is the best
fit model, green is the stellar-continuum only, and red is the stellar
continuum from the stellar kinematics fit. Note that continuum using during
the emission-line module (from MaStar) span (nearly) the full MaNGA spectral
range.
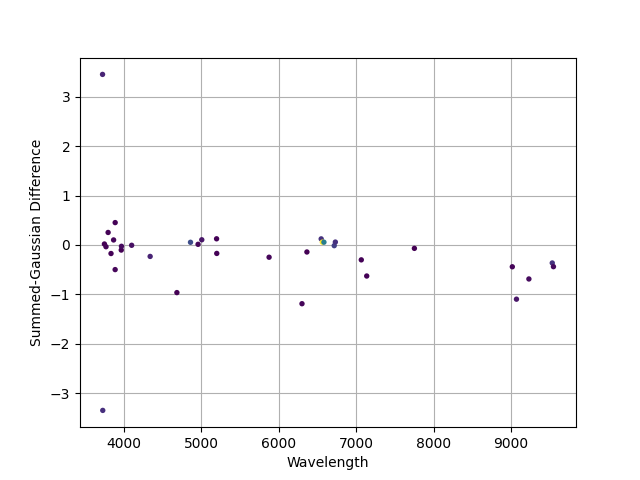
A comparison of the fluxes measured using the non-parametric (summed) approach versus the Gaussian modeling. Point colors are from the “viridis” color map, with purple having low fluxes through green and then yellow with higher fluxes (difficult to see from the figure). Differences are larger at low flux and in the NIR where sky subtraction residuals can be significant.
The block below shows the table of index measurements printed by the script.
-------------------------------------------------------------------------
NAME        Raw Index          err   Index Corr        Index          err
-------- ------------ ------------ ------------ ------------ ------------
Hb             3.9815       0.1776       1.0045       3.9995       0.1784
HDeltaA        4.4995       0.2370       1.0001       4.4998       0.2370
Mgb            2.2928       0.1669       0.9993       2.2912       0.1667
Dn4000         1.2802       0.0085       1.0003       1.2806       0.0085
-------------------------------------------------------------------------
Problems?
If you have problems, particularly those that you think may be a more general problem, please Submit an issue.