Spectral Resolution Matching
When requested or required, the DAP will theoretically match the spectral
resolution of two spectra, assuming the known spectral is provided for both.
The primary function that does this is
match_spectral_resolution() and is largely a
wrapper of the ppxf.ppxf_util.gaussian_filter1d function provided by Michele
Cappellari in the ppxf package.
Here, we provide an example use of the function that demonstrates the accuracy of the spectral resolution matching. This is pulled from a unit test in test_resolution_matching.py.
First, we build a fake spectrum with a set of Gaussian profiles evenly distributed across the MaNGA wavelength range:
import numpy
from mangadap.util.resolution import match_spectral_resolution
from mangadap.util.constants import DAPConstants

# Build a fake spectrum
wave = numpy.arange(3650.0, 10501.0, 0.5)

# Set the resolution to 2.5 angstroms
fwhm = numpy.zeros(wave.shape, dtype=numpy.float64)
fwhm += 2.5
sigma = fwhm/DAPConstants.sig2fwhm
sres = wave/fwhm

# Set the flux to a set of uniform emission lines
flux = numpy.zeros(wave.shape, dtype=numpy.float64)
gc = numpy.linspace(wave[0], wave[-1], num=20)
gs = sigma
for c in gc:
    flux += numpy.exp(-0.5*numpy.square((wave - c)/gs))/numpy.sqrt(2.0*numpy.pi)/gs

# Set the target spectral resolution
new_sres = sres/3.0 + 2.0*sres[0]/3.0 + 300
new_sres = sres-sres+900
new_fwhm = wave/new_sres
new_sigma = new_fwhm/DAPConstants.sig2fwhm
Given that we are convolving one set of Gaussian profiles with another set of Gaussian profiles, we know exactly the Gaussian profiles that should result and can compute the expected convolved spectrum directly:
# Set the flux to a set of uniform emission lines
expected_flux = numpy.zeros(wave.shape, dtype=numpy.float64)
gc = numpy.linspace(wave[0], wave[-1], num=20)
for c in gc:
    expected_flux += numpy.exp(-0.5*numpy.square((wave - c)/new_sigma)) \
                            / numpy.sqrt(2.0*numpy.pi)/new_sigma
Finally, we match the spectral resolution of the input spectrum to the new spectral resolution vector and compare the results.
# Match the resolution
new_flux, matched_sres, sigma_offset, new_mask, _ = \
    match_spectral_resolution(wave, flux, sres, wave, new_sres, min_sig_pix=0.0)
The results are illustrated in the following two plots:
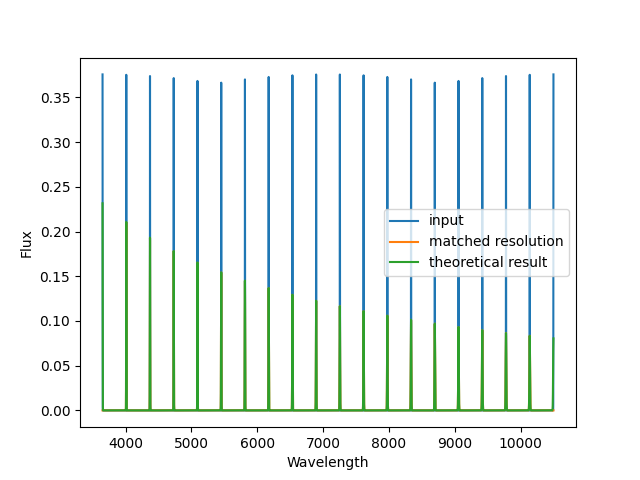
A comparison of the original spectrum (blue) with the expected version after convolving to a lower spectral resolution (green) and the actual result of the convolution (orange).
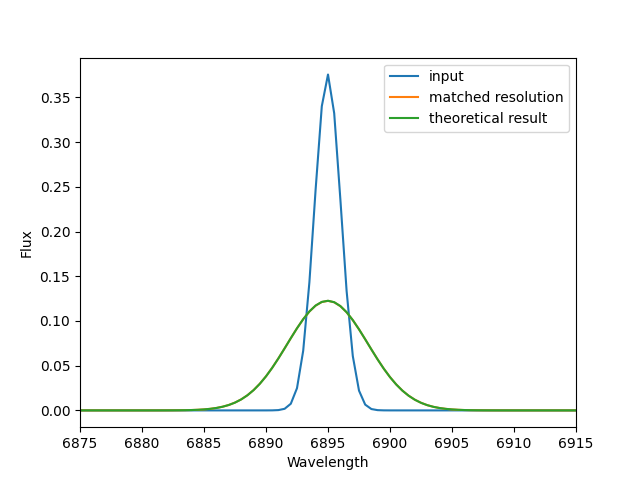
A zoom-in of the same plot, emphasizing that the green and oranges lines are virtually indistinguishable.