Data Analysis Pipeline Workflow
The following summarizes the DAP workflow when executed in the complete analysis of a single MaNGA datacube. This workflow is also described in Section 4 of Westfall et al. (2019, AJ, 158, 231).
Each line in the DAP AnalysisPlan (i.e., each
DAPTYPE) defines how each of the six DAP modules is to analyze
the datacube. Figure 3 from the Westfall et al. (2019, AJ, 158,
231) provides a schematic of the diagram of the workflow, including
the primary python classes:
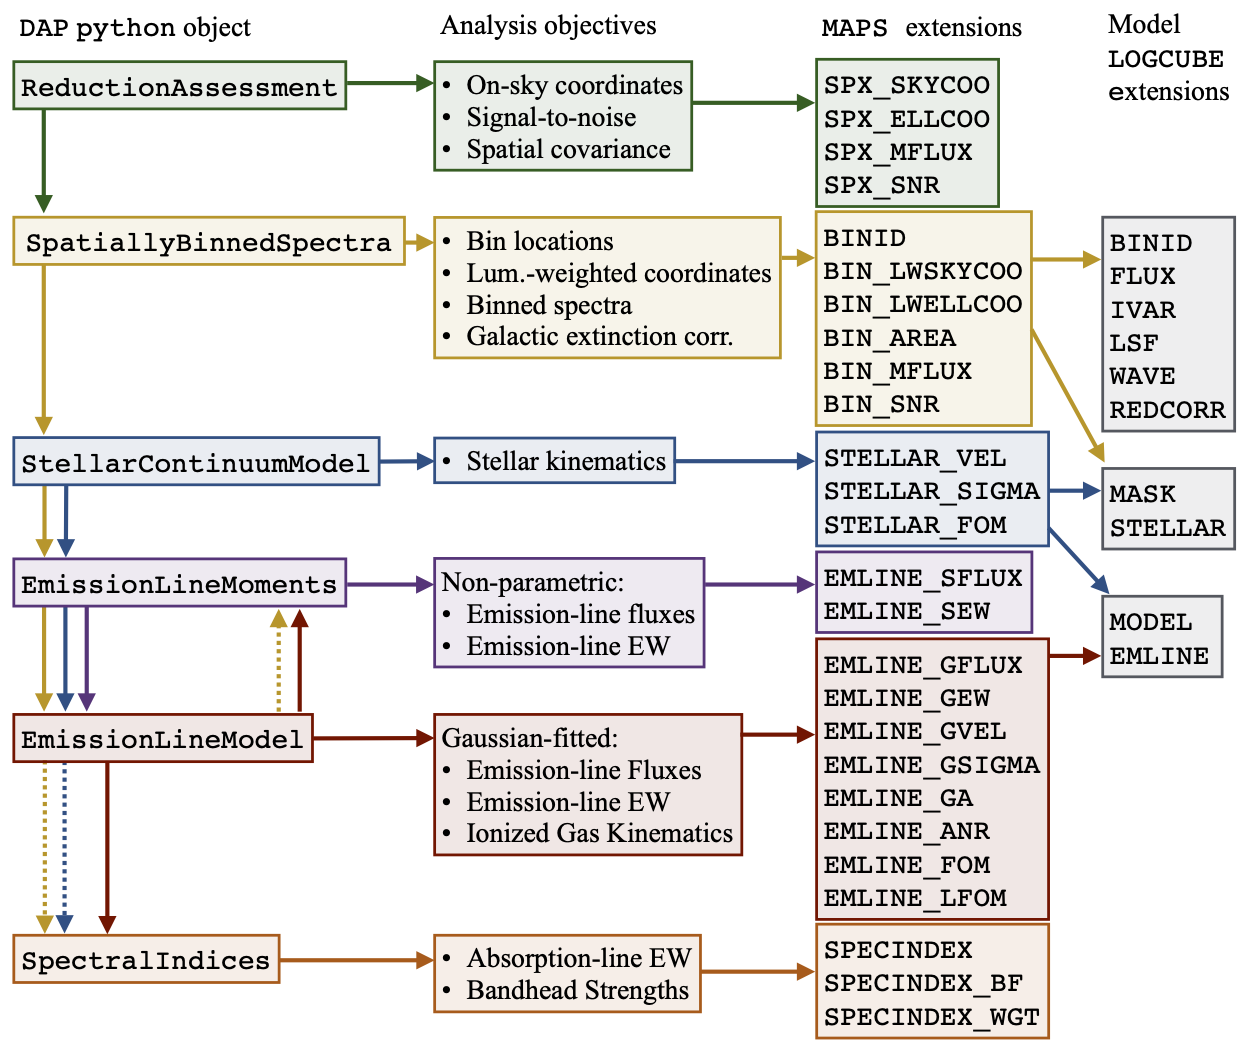
Updated version of Figure 3 from Westfall et al. (2019, AJ, 158,
231): Schematic diagram of the DAP workflow. From left-to-right,
the schematic provides the relevant python modules, the analysis
objectives of each module, and the associated MAPS and model
LOGCUBE extensions generated by each module, as indicated by
the arrows and colors. The python modules, contained within the
named DAP python objects, are ordered from top to bottom by their
execution order; an exception to this is that the emission-line
moments are computed both before and after the emission-line
modeling, as indicated by the two sets of arrows pointing toward
the
EmissionLineMoments
module. Arrow directions indicate the execution order and colors
indicate the module dependencies. For example, the
EmissionLineMoments
object depends on the results of both the
SpatiallyBinnedSpectra
object and the
StellarContinuumModel
object. The dashed arrows indicate conditional dependencies. For
example, the
EmissionLineModel
deconstructs the bins in the hybrid-binning approach, such that
the SpectralIndices are
independent of the primary results of the
SpatiallyBinnedSpectra.
However, there is an explicit dependence of the
SpectralIndices on the
SpatiallyBinnedSpectra
when the hybrid-binning approach is not used.
Analysis Modules
The six main DAP modules and their purpose are:
Basic Reduction Assessments: Much of the DAP analysis is limited to spectra with sufficient S/N and spectral coverage. This first step determines the S/N in each spectrum and the fraction of the spectrum with valid pixels. The current approach uses the g-band-weighted S/N. Using the
DONOTUSEandFORESTARflags from the DRP, the DAP does not analyze any spectrum where fewer than 80% of the spectral channels are valid. This step also calculates the on-sky Cartesian and elliptical coordinates relative to the galaxy center; the elliptical coordinates are based on values in the input parameter files.Spatial Binning: The binning algorithm both determines which spaxels fall in each bin and then stacks the spectra in each bin. The DAP performs all spectral fitting on the binned spectra (termed as such even if a bin only contains a single spaxel) ‘’after’’ they have been corrected for Galactic extinction.
Stellar Kinematics: Once the spectra are binned, the DAP produces a model fit to the stellar continuum, primarily as a determination of the stellar kinamatics using ppxf (written by Michele Cappellari). Currently, the DAP uses the
MILESHClibrary — see Section 5 of Westfall et al. (2019, AJ, 158, 231) — during this fit and only measures the first two moments (\(V\) and \(\sigma\)). The fit is performed with the templates and MaNGA data at their respective (and different) spectral resolutions, such that the velocity dispersions must be corrected for the resolution difference between the templates and the MaNGA data. Understanding these MAPS Corrections and how to apply them are a critical part of using the stellar velocity dispersions.Emission-line Measurements: Once the stellar-continuum fit has been performed, the DAP makes various measurements of the nebular emission lines. Any region beyond the spectral range of the fitted templates will not include an analysis of the emission lines. The DAP performs two sets of emission-line measurements, one based on simple moments of the line profile and a second based on a Gaussian fit:
Emission-line Moments: We provide total flux and equivalent-width measurements based on direct summation of the flux over predescribed rest wavelength bands, accounting for any continuum found in sidebands to the blue and red of each emission line.
Emission-line Modeling: We also simultaneously fit the stellar continuum and a set of emission lines, assuming a single Gaussian component for each line. All line velocities are forced to be the same, we tie the velocity dispersions of neighboring doublets, and we tie the fluxes of doublets that should be fixed quantum mechanically. These fits provide total fluxes and equivalent widths, which can be compared with the direct summation results, as well as fitted velocities and velocity dispersions. The fitted velocity dispersions must be corrected for the instrumental resolution at the observed wavelength of the line; the MAPS Corrections and their application to the data are similar to the corrections for the stellar velocity dispersions.
Spectral-Index Measurements: Finally, spectral indices are measured after subtracting the best-fitting emission-line model from each spectrum. Measurements include both absorption-line (equivalent widths compared to two sidebands) and bandhead (the color of the spectrum based on two passbands) indices. The measurements are performed at the native MaNGA spectral resolution and MAPS Corrections are provided that should effectively set the measurement to a \(\sigma=0\) spectrum.
Output Files
The DAP provides files for each combination of PLATEIFU and
DAPTYPE that are successfully analyzed and a summary table with
salient properties, as described by the Data Model and
Metadata Model, respectively.
The two primary output files, the DAP MAPS file and the DAP Model LOGCUBE file are constructed using the reference files that are produced by each many analysis module.
DAP MAPS File Construction: The
MAPSfile provides 2D “maps” (i.e., images) of DAP measured properties. The shape and WCS of these images identically matches that of a single wavelength channel in the corresponding DRPLOGCUBEfile.DAP LOGCUBE File Construction: The DAP model
LOGCUBEfiles provide the binned/unbinned spectra and the best-fitting model spectra for all spectra that were successfully fit; again the shape of the cube identically matches the DRPLOGCUBEfile.
The DAP table, the DAPall database, provides global
properties extracted from the MaNGA data that can be used in, e.g.,
sample selection. Much of the information in this file is simply
pulled from the headers of the output MAPS or model LOGCUBE
files. However, some quantities are produced uniquely for this file.
The DAPall File Construction is performed after all the
PLATEIFU-DAPTYPE-specific files have been produced for a
given run.